

Statistics & data-viz
A careful compute core and byte-tested charts; nonparametrics, resampling and half the chart types owed.
2 Strong · 4 Solid · 3 Partial · 3 Emerging
Measured against: R · scipy.stats · statsmodels · matplotlib · Folders: base/stats(opens in a new tab) · For programmers: this area's reference
Rethought from first principles
What Softanza kept from what works, and what it rethought, as the library wrote it down in its design documents and narrations.
The Softanza wayExplore before you model: data is a fit plus a residual, computed so that one wild value cannot sway it, and the data itself tells which scale to read it on.
Kept from the best practice
- Variance divides by N−1 by default, as in R and pandas. The choice is written once in the engine, so every module gives the same answer. source(opens in a new tab)
- Tukey's methods are used as he defined them: fourths, median polish, resistant line, smoothers. They are checked against R and published examples, never against the library's own output. source(opens in a new tab)
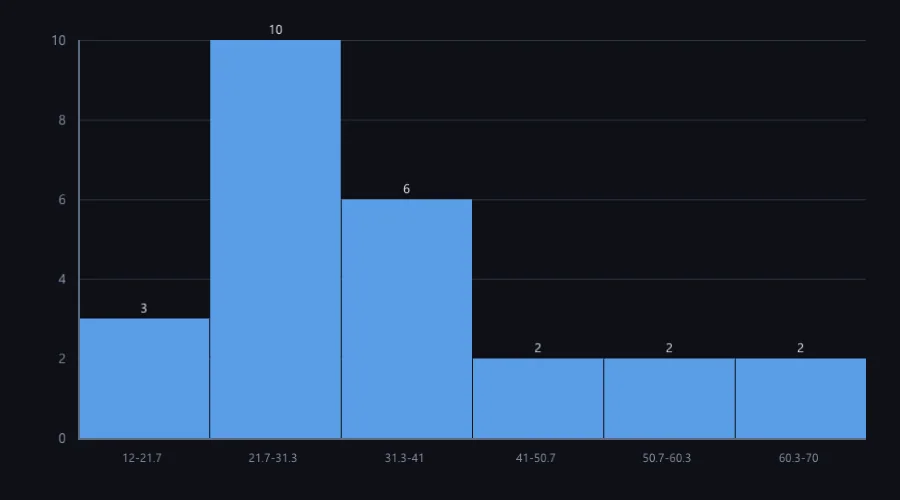
- Charts keep the classic craft: axis ticks on round numbers (1, 2, 2.5 or 5 times a power of ten), a legend for several series, histogram bars that touch. source(opens in a new tab)
Rethought
- Exploration emits no p-values, intervals or forecasts. Inference is called deliberately, so a pattern found in the data is never presented as a hypothesis posed beforehand. source(opens in a new tab)
- Ambiguous conventions are named, never picked silently. Tukey's fourths and percentile quartiles both ship, because measurement showed they differ, and every display prints which one it used. source(opens in a new tab)
- A story told about data does no arithmetic. Every number in the prose is read from the fit or a finding, and a check refuses any unsourced numeral. source(opens in a new tab)
- One chart model, several render targets. Terminal, SVG and PNG share the meaning (values, labels, flags) but not the layout, since character cells and pixels differ. source(opens in a new tab)
The compute core is genuinely careful -- SIMD Neumaier summation, engine hypothesis tests that never return a bare p-value, and a chart pipeline byte-tested against captured ground truth. But this is not yet scipy.stats or R: nonparametric tests, resampling and time-series are absent, half the analyst's chart types don't render, and the exploratory (Tukey) tier is a plan with no code. A strong foundation, honestly incomplete.
What a crafter does with it, and what stands out
- Lane-parallel Neumaier compensated summation (measured 2.5x)
- Hypothesis tests never return a bare p-value: effect size and a conclusion with every one
- Chart renderers byte-tested against captured ground truth (107 parity assertions)
- Three backends per chart: engine terminal, deviceless SVG, GPU PNG
What is owed
- Nonparametric and normality tests (Mann-Whitney, Kruskal-Wallis, KS, Shapiro-Wilk)
- The statistical chart family (box, violin, pie/donut, heatmap, area)
- Bootstrap CI and permutation test over the existing sampler
- Multiple regression, GLM and diagnostics; a real time-series lane; the unbuilt Tukey tier
The Softanza way, run
What Softanza does differently in this area, shown by code taken from its narrations and guards, and run for this page.
A resistant summary states in words which convention it used, so hinges are never confused with quartiles.
aV = [ 2, 4, 4, 5, 7, 9, 12, 25 ]
oS = StzTukeySummaryQ(aV)
? oS.Why()
a Tukey summary of 8 value(s) under Tukey's fourths (hinges at depth (floor((n+1)/2)+1)/2): hinges 4 | 6 | 10.5, fourth-spread 6.5, 1 outside, 0 far out
run on 2026-10-01 21:18 inside the library at commit 0e72e2e2c; taken from base/education/program/courses/math/chapters/13-tukeys-first-look.en.md(opens in a new tab)
A table fitted by medians becomes verdicts a program can gate on: the report says the table is not sound, and which residual breaks it.
aDeaths = [ [ 14, 15, 14 ], [ 7, 4, 7 ], [ 8, 2, 10 ], [ 15, 9, 10 ], [ 0, 2, 0 ] ]
oF = StzTukeyFitQ(aDeaths)
oF.Polish()
oRep = StzTukeyReportQ("deaths", [ oF ])
? oRep.IsSound()
aE = oRep.Errors()
? len( aE )
? aE[1][:message]0 2 residual -5 lies 5 fourth-spread(s) past the hinge, beyond the far-out fence at 3
run on 2026-10-01 21:18 inside the library at commit 0e72e2e2c; taken from base/education/program/courses/math/chapters/13-tukeys-first-look.en.md(opens in a new tab)
Continuing the fit above, the story computes nothing and checks on itself that every number it prints comes from the fit or a finding.
oSt = StzTukeyStoryQ(oF, oRep)
acP = oSt.Paragraphs()
? acP[1]
? oSt.IsHonest()
A table of 5 rows and 3 columns was fitted by median polish, which converged in 2 sweep(s). The common value is 8 and the residuals' fourth-spread, the scale every judgement below is in, is 1.
1
run on 2026-10-01 21:18 inside the library at commit 0e72e2e2c; taken from base/education/program/courses/math/chapters/13-tukeys-first-look.en.md(opens in a new tab)
The lanes, one by one
Lanes and their notes are quoted as they were read at the source, on Read from the source on 2026-09-16.